Emerging Markets Fixed Income
Poised to Thrive in the Fed’s Easing Wave
After two years of an aggressive Federal Reserve (“Fed”) tightening cycle whereby the Federal Open Market Committee (“FOMC”) raised the federal funds target rate by 525 basis points, making it the fastest tightening cycle in four decades, we are finally on the cusp of a first rate cut by the Fed later this month. With U.S. inflation having come down drastically from its peak of 9.1% in mid-2022 (although still short of the 2% target) and with a softening labor market, investors are currently pricing in 200 basis points of Fed cuts through the end of 2025, with a 25 to 50 basis point cut expected this September.
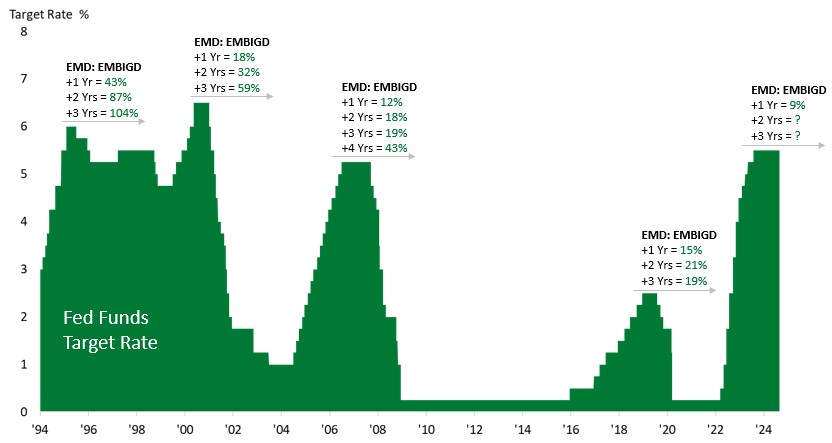
The Emerging Markets (“EM”) fixed income asset class is likely to be a key beneficiary of the Fed’s easing cycle. Historically, the average cumulative return of the EMBI Global Diversified Index (“EMBIGD”) was 19%, 39% and 50% in the 1, 2 and 3 years, respectively, following the conclusion of a hiking cycle in the U.S. (see Exhibit 1).
Exhibit 1: EM debt performs well following the conclusion of a Federal Reserve hiking cycle

Source: Bloomberg and JPMorgan. Data as of August 31, 2024.
There are three primary reasons why we believe EM debt returns should be robust in this easing cycle as well.
1. Fed easing creates space for EM Central Banks to follow suit, leading to a positive feedback loop to local growth and fundamentals
When the Fed begins to cut rates, several key EM central banks may find themselves in a position to follow suit and lower interest rates, thereby boosting economic growth and fundamentals domestically by making borrowing cheaper for corporates and consumers. For countries with significant debt, lower interest rates can reduce the cost of servicing debt, freeing up resources for other productive uses such as infrastructure. Considering the historically strong connection between Latin America and Fed policy, we anticipate that central banks in the region, including those in Chile, Colombia and Mexico, will seize the opportunity presented by the Fed’s cuts this September to enact their own reductions amidst slower than anticipated economic activity and expectations that inflation metrics continue to trend toward target ranges.
2. Alluring yields in EM boosted by solid fundamentals
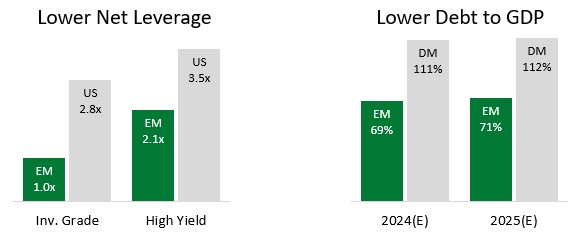
EM debt is currently offering compelling yields, with the JPMorgan EMBI Global Diversified Index yielding 7.9% and the JPMorgan CEMBI Broad Diversified Index yielding 6.5%. These figures represent significant increases of 160 and 76 basis points over the last decade’s average, respectively. Such attractive valuations are bolstered by the strong fundamentals of EM sovereigns and corporates compared to their developed market (“DM”) counterparts (see Exhibits 2 & 3).
Exhibits 2 & 3: EM economies and companies have half the debt to GDP and half the net leverage of DM

Source: JPMorgan, Bloomberg, IMF World Economic Outlook (April/July 2024). As of August 2024.
Over the past few years, EM economies have demonstrated remarkable resilience, driven by several key factors: proactive central banks implementing effective monetary policies, prudent macroeconomic strategies, substantial foreign exchange reserves providing stability, and proactive liability management during low interest rates. This robust framework fuelled economic growth, with EM GDP surprising at 4.3% in 2023, significantly outpacing the 1.6% growth in developed markets; similar trends are expected by the IMF for 2024.
Additionally, positive structural reforms have led to a wave of credit rating upgrades for EM sovereigns, which in turn have enhanced corporate credit ratings (see Exhibits 4 & 5). This upward trend in ratings reduces borrowing costs, thereby strengthening fundamentals and setting the stage for improved bond performance over time.
Exhibits 4 & 5: Net upgrades have turned positive on the back of improving fundamentals and solid policymaking

Source: JPMorgan, Bloomberg, S&P, Fitch and Moody’s. Sovereign data as of June 15, 2024; Corporate data as of July 18, 2024.
3. Improved global risk sentiment could drive inflows into the asset class following years of substantial outflows
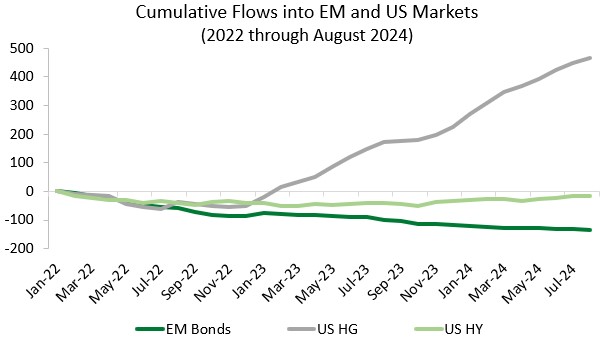
EM bond funds faced substantial outflows of approximately $90bn in 2022, with the flows evenly divided between hard currency and local currency. This trend continued in 2023, resulting in an additional $34bn in outflows, $25bn of which came from hard currency. As of August 2024, there were additional outflows from EM debt of $16bn, bringing the total cumulative outflow to $134bn since early 2022. In contrast, U.S. investment grade and U.S. high yield bond funds saw cumulative inflows of $241bn and $17bn, respectively, from 2022 through August 2024. Despite the ongoing significant outflows from EM bond funds, the EMBI GD and CEMBI BD delivered impressive positive returns of 11.1% and 9.1% in 2023. Through August 31st, 2024, returns are also trending nicely at 6.7% and 7.2%, respectively (data sourced from JPMorgan).
We believe these trends indicate that investor allocations to EM debt are at multi-year lows, positioning the asset class for a potential rebound once the Fed initiates its easing cycle and global risk sentiment improves (see Exhibit 6).
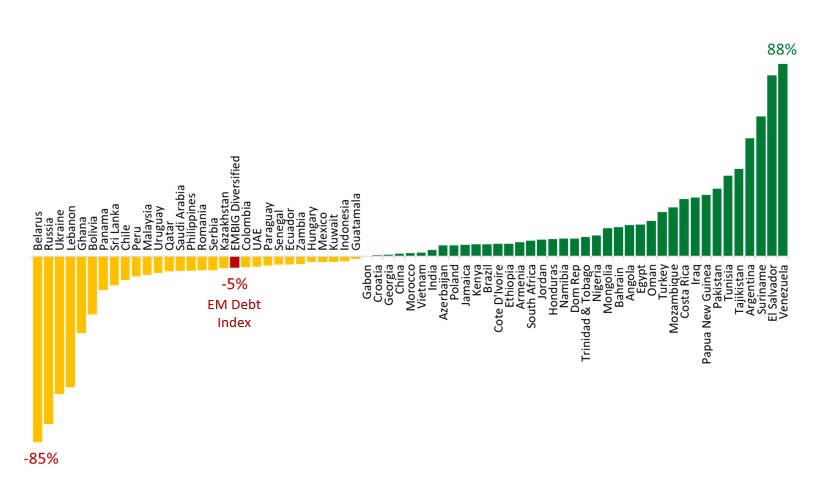
While the global macroeconomic environment has become more favorable for EM debt and fundamentals are improving, we believe active management is essential for navigating the diverse opportunities within the EM debt space as well as addressing potential tail risks, such as rising geopolitical tensions or increased volatility surrounding the upcoming U.S. Presidential election in November, which may impact some EM economies
Exhibit 6. After almost three years of outflows, EM debt technicals are set to become a powerful tailwind

Source: EPFR, Bloomberg, JPMorgan Weekly Flows Monitor as of August 30, 2024. EM Flows Weekly includes fund flow data, non-resident EM portfolio flow data, weekly retail fund flow models, EM-dedicated retail bond fund beta trackers, and historical cross-asset fund flows.
and companies more than others. The significant potential for dispersion of performance within EM debt underscores the necessity for a strong team of EM research analysts and portfolio managers who possess a deep understanding of the intricacies of EM credit (see Exhibit 7).
Exhibits 7: EM debt index performance by country since September 2021 shows that dispersion of returns is wide, necessitating active management

EM Debt Index = JPM EMBI Global Diversified Index. As of August 31, 2024. Source: Bloomberg, JPMorgan. Country data reflects that of the EMBIG Diversified sub-indices. The Emerging Market Bond Index Global Diversified (EMBIG Diversified) and its relevant sub-indices provide full coverage of the USD-denominated EM sovereign bond asset class with representative countries, investable instruments (sovereign and quasi-sovereign), a diversified allocation scheme and transparent rules.
Conclusion
In conclusion, we believe the upcoming easing cycle by the Federal Reserve represents a significant opportunity for EM debt. Historically, EM debt has performed well following U.S. rate cuts, and with EM central banks likely to lower rates to stimulate growth, the asset class is well-positioned for strong returns. Attractive yields, supported by solid fundamentals and a rebound in global risk sentiment, further enhance its appeal. However, the complexities and potential risks inherent in EM debt necessitate active management. By leveraging expertise and thorough research, investors can navigate this dynamic landscape, capitalize on diverse opportunities, and effectively safeguard their capital.
September 2024
About Gramercy
Gramercy is a global emerging markets investment manager based in Greenwich, Connecticut with offices in London, Buenos Aires, Miami, West Palm Beach and Mexico City, and dedicated lending platforms in Mexico, Turkey, Peru, Pan-Africa, Brazil, and Colombia. The firm, founded in 1998, seeks to provide investors with a better approach to emerging markets, delivering attractive risk-adjusted returns supported by a transparent and robust institutional platform. Gramercy offers alternative and long-only strategies across emerging markets asset classes including multi-asset, private credit, public credit, and special situations. Gramercy’s mission is to positively impact the well-being of our clients, portfolio investments and team members. Gramercy is a Registered Investment Adviser with the SEC and a Signatory of the Principles for Responsible Investment (PRI), a Signatory to the Net Zero Asset Managers initiative and a Supporter of TCFD. Gramercy Ltd, an affiliate, is registered with the FCA.
Contact Information:
Gramercy Funds Management LLC
20 Dayton Ave
Greenwich, CT 06830
Phone: +1 203 552 1900
www.gramercy.com
Joe Griffin
Managing Director, Business Development
+1 203 552 1927
[email protected]
Investor Relations
[email protected]
This document is for informational purposes only, is not intended for public use or distribution and is for the sole use of the recipient. The information set forth herein and any opinions herein do not constitute an endorsement, implied or otherwise, of any securities, nor does it constitute an endorsement with respect to any investment area or vehicle. It is not intended as an offer or solicitation for the purchase or sale of any financial instruments or any investment interest in any fund or as an official confirmation of any transaction. Opinions, estimates and projections in this report constitute the current judgement of Gramercy as of the date of this report and are subject to change without notice. All market prices, data and other information, are not warranted as to completeness or accuracy and are subject to change without notice at the sole and absolute discretion of the Investment Manager. Gramercy has no obligation to update, modify or amend this report or otherwise notify a reader hereof in the event that any matter stated herein, or any opinion, projection, forecast or estimate set forth herein, changes or subsequently becomes inaccurate. Certain statements made in this presentation are forward-looking and are subject to risks and uncertainties. The forward-looking statements made are based on our beliefs, assumptions and expectations of future performance, taking into account information currently available to us. Actual results could differ materially from the forward-looking statements made in this presentation. When we use the words “believe,” “expect,” “anticipate,” “plan,” “will,” “intend” or other similar expressions, we are identifying forward-looking statements. These statements are based on information available to Gramercy as of the date hereof; and Gramercy’s actual results or actions could differ materially from those stated or implied, due to risks and uncertainties associated with its business. Unless otherwise stated, all representations in this presentation are Gramercy’s beliefs based on sector knowledge and/or research. Past performance is not necessarily indicative of future results. Any reference to net returns reflect the deduction of management fees, carried interest, unconsummated transaction fees, professional fees, organizational fees and interest. Such fees and expenses will reduce returns to investors and in the aggregate, may be substantial. References to any indices are for informational and general comparative purposes only. There are significant differences between such indices and an investment program of Gramercy. A Gramercy Fund may not invest in all or necessarily any significant portion of the securities, industries, or strategies or represented by such indices. Indices are unmanaged, and their performance results do not reflect the impact of fees, expenses, or taxes that may be incurred through an investment with Gramercy. Returns for indices assume dividend reinvestment. An investment cannot be made directly in an index. Accordingly, comparing results shown to those of such indices may be of limited use. This presentation is strictly confidential and may not be reproduced or redistributed, in whole or in part, in any form or by any means. © 2024 Gramercy Funds Management LLC. All rights reserved.
